The Israeli Ministry of Defense’s R&D Directorate (MAFAT) launched a fascinating data-science challenge on April 13th, 2022: MAFAT Challenge – WiFi Sensing – Non Invasive Human Presence Detection. The participant's goal was to identify whether a particular room is empty or occupied and to infer how many people were present in the room by analyzing the RSSI measurements of a Wireless network.
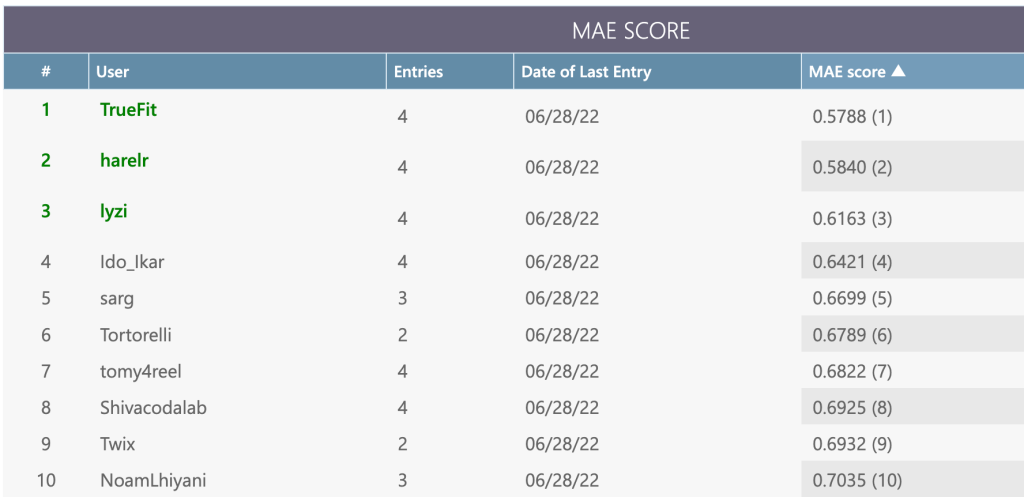
We interviewed TrueFit, the first-place prize-winner in track 2 and the second-place prize-winner in track 1.
The Challenge:
The challenge was to detect and count human occupancy within rooms using WiFi RSSI data. In the first track of the competition the goal was to detect whether a particular room is empty or occupied, and in the second track the goal was to count how many people are present in the room. The data consists of a WiFi Received Signal Strength Indicator (RSSI), recorded from a router. The RSSI data was collected from WiFi channels established between the router and various devices: laptops, cell phones, tablets, and Raspberry Pis.
For further information please see the competition page.
Hi TrueFit, congratulations! First of all, please tell us about yourself.
My background lies in the Mathematics and machine learning fields. I run a consultancy firm based on machine learning and deep learning analysis. I have a lot of experience in Kaggle and machine learning competitions and challenges. I’m not active on Kaggle at the moment, but I was ranked 10 on Kaggle for a while and won some competitions. I did some competitions in “DrivenData” lately and some more government competitions, and participated in NASA’s Mars Spectrometry challenge.
I have a very strong background in time-series forecasting and when I saw this WiFi challenge I thought that it shares some common insights with Nasa’s challenge – what do you do with those “spectral” unsolved problems?
How did you approach the challenge? What was your general strategy?
Time series forecasting is my specialty and I have some experience in this kind of challenge, so my general strategy was to use the knowledge I have gained over time and apply it to this challenge.
My general approach was to create an ensemble of many different models and to let those models vote for the final prediction. Therefore, I created an ensemble of LightGBM models and CNN+MLP models. Toward the end of the public phase, I decided to add “Visual transformers” to the ensemble. For each of those three different architectures, I took a slightly different approach which is reflected in the features, data augmentation, etc.
For the models weighing, I took an evolutionary search approach. I ranked all the models by their cross-validation performances. My final ensemble included 196 models.
Did you split the given training data into training and validation sets? How?
I splitted the data into training and validation sets using cross validation. The split was done by rooms, each model fold contained 4 rooms for training, and the other 2 rooms were dedicated to validation. For each model, I performed the k-fold process and trained the model over different sets of 4 rooms, so overall each model was trained over 15 different permutations of the training set. Eventually, I took the models with the best validation performance.
For the transformer models, I took a slightly different approach and trained the models over 5 rooms and only 1 room dedicated to validation so overall I had 6 different permutations.
Did you perform any feature engineering? What interesting features did you have in your models?
From my experience, time series forecasting usually involves hand-engineered features. I started by calculating the average between the 2 antennas' signal values and the difference between them. With those values, I created standard statistical features: Standard deviation, the absolute values of the average between the samples, etc. Overall I think that one of the things that stood out was the importance of the signal sequences, which is reflected in two features that were the most interesting and meaningful: The first one is the number of times the values from the longest sequence appear in the 3\5\10\20 longest sequences. The second one was the number of the most common values divided by the window length.
For the visual transformer models, I looked into signal segments, without the statistical calculations, and created a kernel that expresses the same features.
Which augmentation did you perform over the data?
In order to get the most out of the given training data, I performed different augmentations that increased the size of the training set. At first, I tried Flip L-R augmentation but it got worse performance so I didn’t use it. Eventually, I took a different approach for each of the three different models I had: for the GBT I created a sliding window and started from different starting points in the windows. For the NN models I started from a random point, and for the transformer, I removed 5 signal points randomly from a 180-second sliding window. By doing so I ensured that all of the 196 models were trained over different and diverse data.
How did you make the final prediction?
The output of the models was a sequence of 4 probabilities for the number of people in the room: 0, 1, 2, or 3. Then I calculated the weighted average for all of the outputs and normalized the total sum in order to get a probability. The first value (0/1/2/3) that got over 50% cumulative distribution is the final predictor for room occupancy.
For the occupancy prediction track, I calculated the weighted average for the room occupancy prediction.
Thank you for this interview! And congratulations for winning this challenge! Do you have any more interesting insights you want to share?
I think there are mostly three important things I learned from this challenge. First, I re-discovered how important it is to craft and engineer a good set of features for those types of “spectral time series” challenges. Second, trusting the local cross-validation process proved to work well (and not to use the public leaderboard to assess the models' performance). Cross-validation can help avoid over-fitting, unlike the public leaderboard.
Third, I learned that if you use the Visual Transformer architecture correctly with engineered features – it is the best architecture for such a challenge.


אתם חייבים להיות מחוברים על מנת לשלוח תגובה.